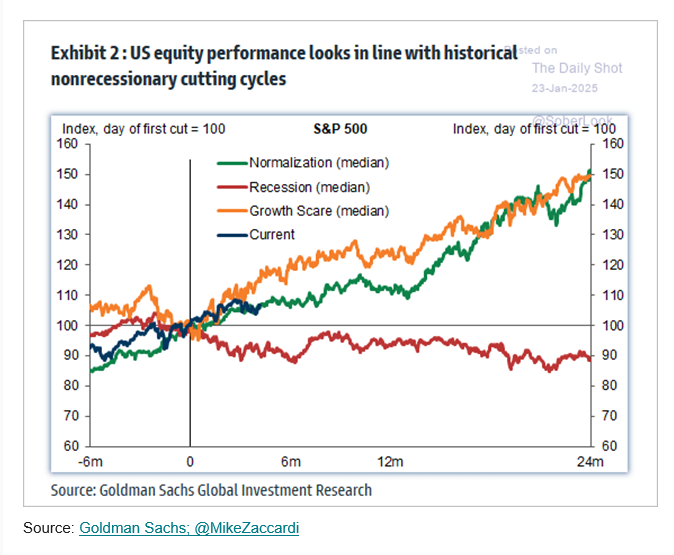
Nice chart ... but ...
Someone needs to calc what the implied trailing 10yr PE would be if it made it to 24 months ... and equally what happens in a 5th year when a market makes 4 back to back 20%+ gains ... off the back of 7 stocks ... my guess is that it's ugly ...